PCP Economic Dashboard
At a Glance
Client: Pictou County Partnership
Timeline: Feb – Mar 2026
Scope: Data sourcing, dashboard design, Tableau build, documentation, and handoff
Tools: Tableau Public, Google Sheets, Statistics Canada
The Challenge
Pictou County Partnership needed a clear, credible way to present economic data to external audiences — particularly investors, site selectors, and potential employers.
Existing data was:
- Spread across multiple sources
- Difficult to interpret quickly
- Not structured for non-technical audiences
The goal was to use dependable data to tell a simple, trustworthy story about the region.
The Approach
I designed a single, consolidated dashboard that transforms raw public datasets into a clear economic snapshot.
The solution focused on:
- Scannability → key metrics visible at a glance
- Narrative structure → labour, talent, housing, and livability grouped logically
- Credibility → all data sourced from authoritative datasets
- Sustainability → built for easy updates, not one-time use
The final product balances visual clarity, technical accuracy, and long-term maintainability.

Outcomes
This project delivered a reliable, repeatable system for communicating economic data that's rolled up into a public-facing dashboard.
From fragmented public datasets, I built a structured pipeline that transforms raw information into a clear, investor-facing narrative. This included sourcing and validating data, aligning inconsistent formats, and creating derived indicators such as grouped talent fields and commute summaries.
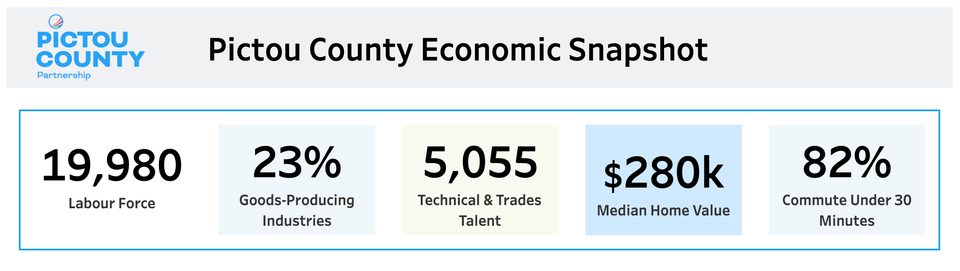
The final dashboard presents a complete snapshot of Pictou County’s economy, workforce, and livability in a format that is immediately scannable and easy to interpret.
Just as importantly, the solution was designed for long-term independence. The delivery included a fully structured source spreadsheet, step-by-step documentation, and a repeatable update workflow, allowing the client to maintain and refresh the dashboard without ongoing technical support.
Key outcomes:
- Delivered a complete, public-facing economic dashboard
- Transformed complex datasets into a clear, accessible narrative
- Established a maintainable data workflow for future updates
Full Case Study
Explore the full breakdown, including design decisions, structure, and implementation details:
https://pdfs.mannyroy.com/CS--PCP%20Economic%20Dashboard-v1-04242026--6f3b2f9c0d8b4a6f.pdf
A strong handoff preserves context and keeps the work usable long after delivery.
Interested in building something similar?
Let’s chat it out :)